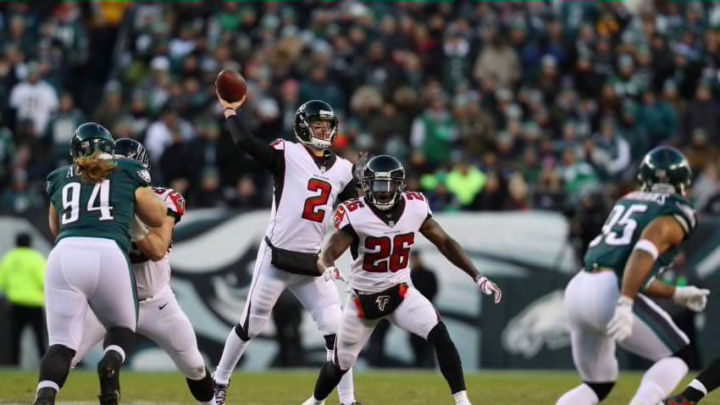
Tight Ends
Austin Hooper
83 Targets, 59 catches, 705 receiving yards, 7 receiving Touchdowns
Eric Saubert
18 Targets, 12 catches, 150 receiving yards, 1 receiving Touchdown
Logan Paulsen
3 Targets, 2 catches, 14 receiving yards, 1 receiving Touchdown
The Quarterback Matt Ryan gets compared to the most is the great Peyton Manning due to his mechanics and understanding of the game. If that’s the case then we must compare Austin Hooper to Julius Thomas who ironically entered his 3rd season in 2013 with Manning and the Denver Broncos. That Broncos Offense was the highest scoring Offense in NFL history. Thomas who enjoyed 2 Pro Bowl season with Manning and Broncos before being traded after the 2014 season to the Jaguars. His career was never the same after that. Hooper like Thomas has worked incredibly hard these past few offseason, working on timing with Ryan. His trajectory lines up almost identical with Thomas who went from 5 career receiving yards (2011-12) to 788 yards and 12 receiving Touchdowns in 2013. Hooper is more established so the transition shouldn’t be as hard.
Team Totals
Passing
579 Attempts, 399 completions, 5,291 receiving yards, 43 receiving Touchdowns
Rushing
460 Attempts, 2,161 rushing yards, 21 rushing Touchdowns
7,452 yards from scrimmage, 64 total Touchdowns
Overall, I feel we as fans have put a cap on just how good these Falcons can actually be. 2017 has left a bad taste in folks mouth and 2016 was so fun to watch but it put a cap in a bunch of people’s minds, but what if it was just a blueprint for what is coming?
| 2018 Atlanta Falcons Offensive Projection | |||||||||||||
| Passing | |||||||||||||
| Att | Cmp | Yds | TD | Int | |||||||||
| RYAN | 579 | 398 | 5226 | 42 | 9 | 68.7% | |||||||
| SANU | 1 | 1 | 65 | 1 | |||||||||
| Receiving | Rushing | Total Yds | |||||||||||
| POS | Tgt | Rec | Yds | Y/R | TD | Rush | Yds | TD | Y/R | Touch | YScm | RRTD | |
| RYAN | QB | 0 | 0 | 0 | 0 | 30 | 141 | 1 | 4.7 | 30 | 141 | 1 | |
| JONES | WR | 130 | 85 | 1480 | 17.4 | 10 | 1 | 20 | 20 | 86 | 1500 | 10 | |
| RIDLEY | WR | 95 | 64 | 820 | 12.8 | 7 | 1 | 15 | 15 | 65 | 835 | 7 | |
| SANU | WR | 84 | 57 | 690 | 12.1 | 5 | 2 | 16 | 8 | 59 | 706 | 5 | |
| HARDY | WR | 37 | 20 | 215 | 10.8 | 2 | 0 | 0 | 0 | 0 | 20 | 215 | 2 |
| HALL | WR | 5 | 3 | 70 | 23.3 | 1 | 0 | 0 | 0 | 0 | 3 | 70 | 1 |
| GAGE | WR | 5 | 3 | 36 | 0.4 | 1 | 0 | 0 | 0 | 0 | 3 | 36 | 1 |
| FREEMAN | RB | 50 | 41 | 380 | 9.3 | 2 | 225 | 1065 | 10 | 4.7 | 266 | 1445 | 12 |
| COLEMAN | RB | 54 | 46 | 650 | 14.1 | 4 | 180 | 830 | 8 | 4.6 | 1480 | 12 | |
| SMITH | RB | 8 | 3 | 36 | 12.0 | 1 | 20 | 70 | 1 | 3.5 | 23 | 106 | 2 |
| ORTIZ | RB | 7 | 4 | 45 | 11.3 | 1 | 1 | 4 | 1 | 4 | 5 | 49 | 2 |
| HOOPER | TE | 83 | 59 | 705 | 11.9 | 7 | 0 | 0 | 0 | 0 | 59 | 705 | 7 |
| SAUBERT | TE | 18 | 12 | 150 | 12.5 | 1 | 0 | 0 | 0 | 0 | 12 | 150 | 1 |
| PAULSEN | TE | 3 | 2 | 14 | 7 | 1 | 0 | 0 | 0 | 0 | 2 | 14 | 1 |
| Team | 579 | 399 | 5291 | 43 | 460 | 2161 | 21 | 633 | 7452 | 64 |
